Host Spotlight: ROOT
Primary trust zone hosting shared services and administrative access.
- Core services live here and are shared across the environment (e.g., DNS, monitoring, internal tooling).
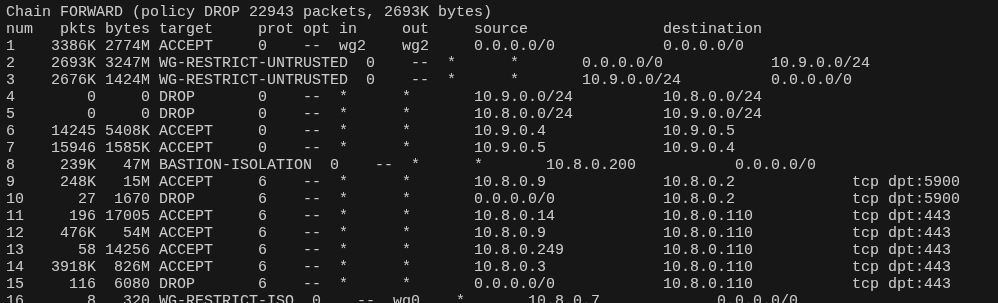
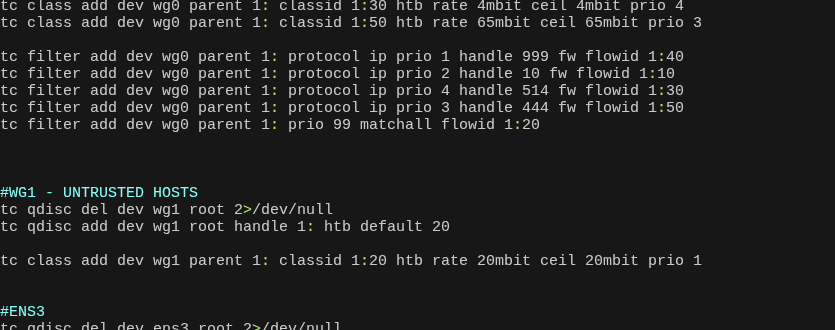
- Forwarding is tightly scoped: client-to-client reachability is restricted to only what is required.
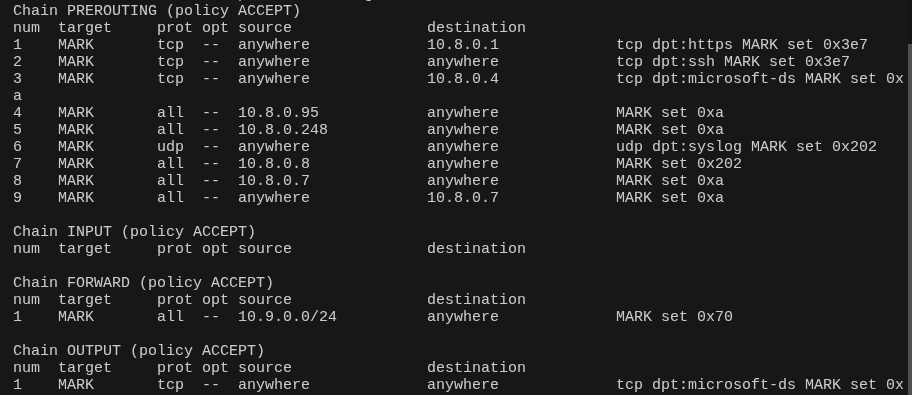
- Policy enforcement via iptables using dedicated chains to control inter-zone forwarding and service access.
- Rate limiting enforced with tc using packet marking (per-IP / per-protocol shaping) to prevent saturation and enforce fairness.
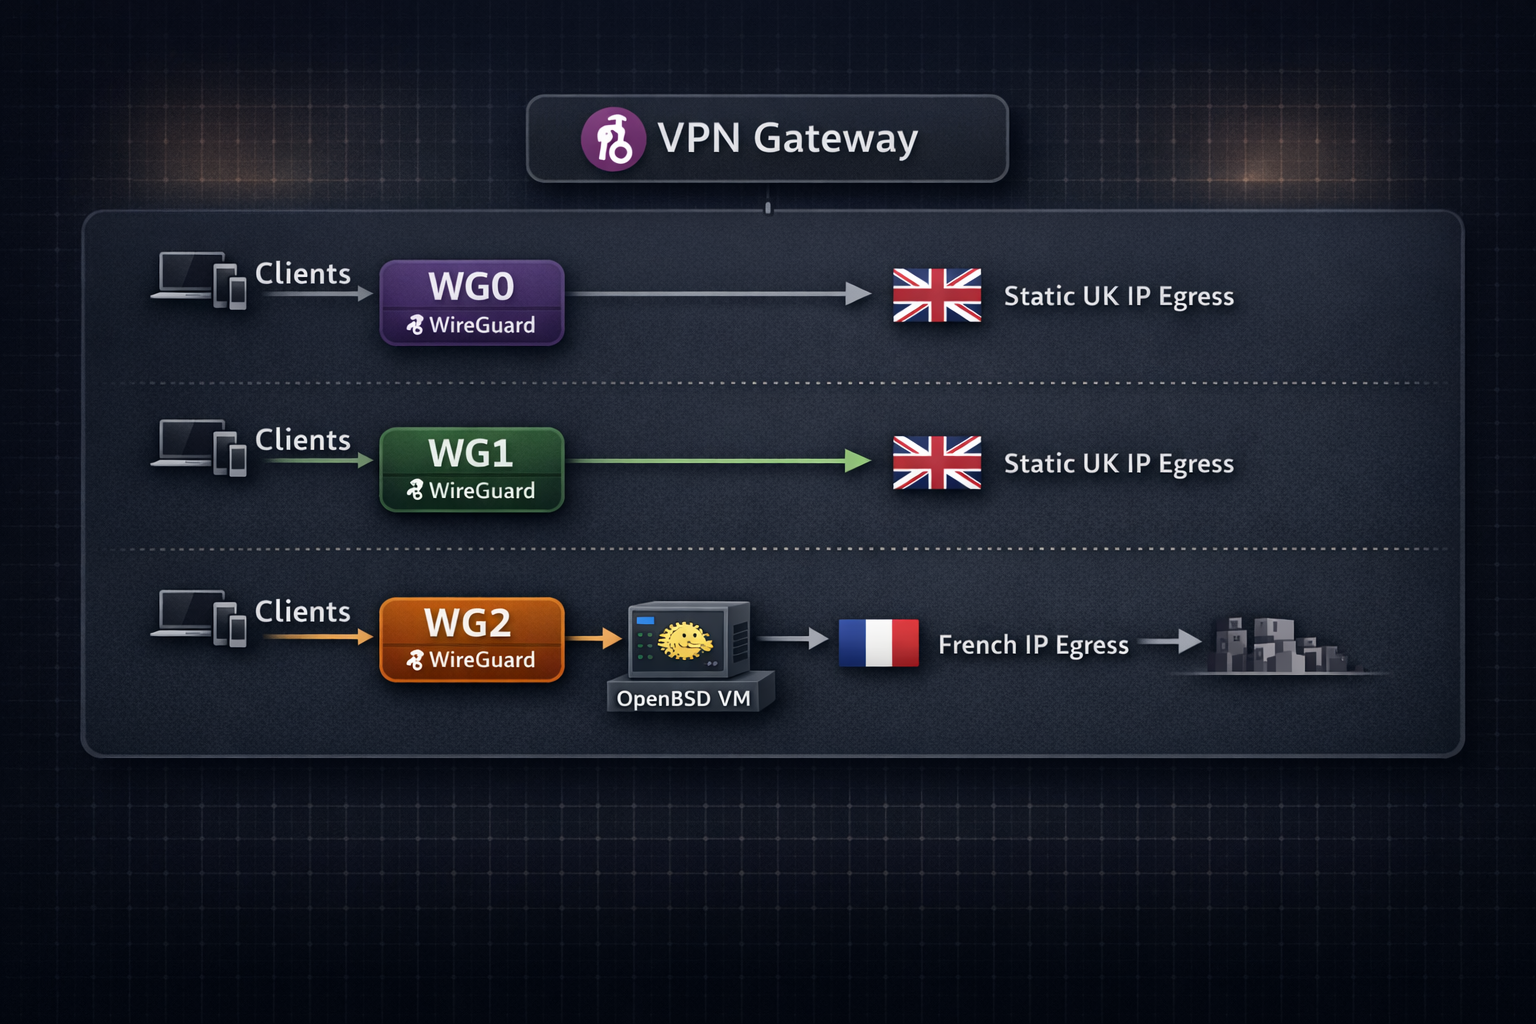
- Consistent identity egress: selected traffic exits via a static UK IPv4 for stable online identity where required.
Isolated zone for family/mobile devices.
- Hard bandwidth limits applied to all clients (20 Mbps up/down) to protect core infrastructure and uplink capacity.
- Client isolation by default: no lateral movement between clients is permitted.
- Service access is explicit and granted on a case-by-case basis (allowlist model).
- Controlled egress via the same static UK IPv4 when consistent identity is required.
Ingress on ROOT with egress routed through OpenBSD VM.
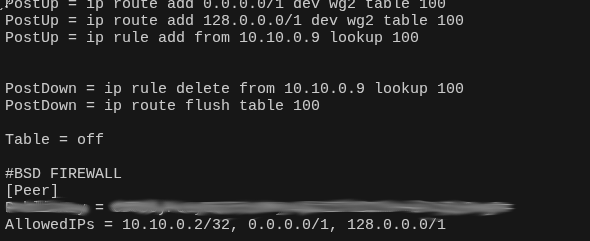
- Ingress and egress are separated: traffic enters via ROOT and exits via the OpenBSD VM, resulting in different ingress/egress IPs.
- Privacy-oriented routing: reduces direct correlation between VPN entry and exit points (in theory, depending on threat model).
- Full internet egress via OpenBSD: default routes (
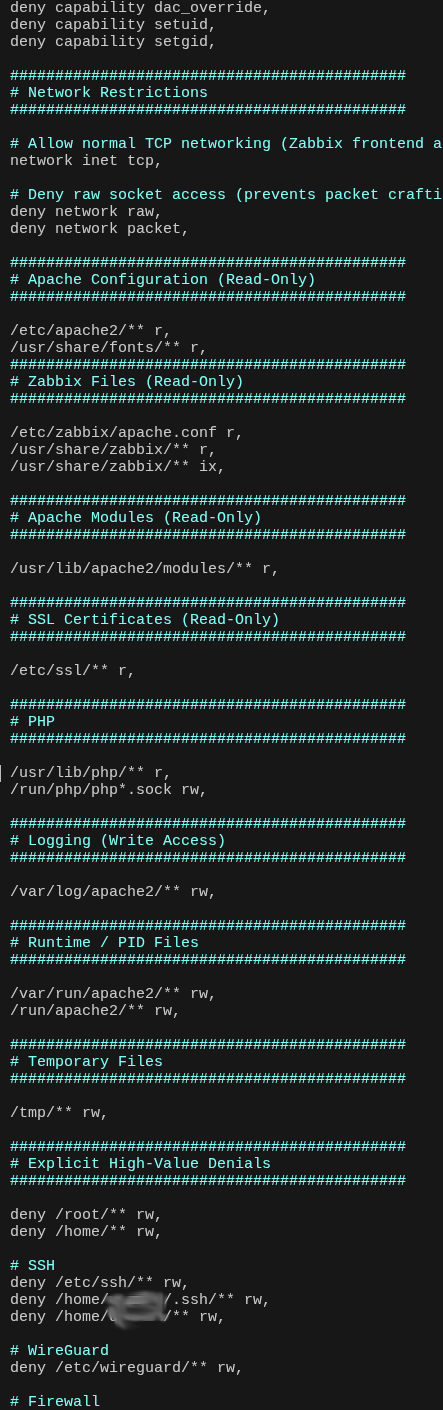
0.0.0.0/1and128.0.0.0/1) point to the OpenBSD VM. - PF firewall enforces egress filtering and NAT is performed on the OpenBSD VM using a French egress IP.
In the event of VPN or inbound connectivity failure, SSH access is maintained via Tor hidden services. This provides an independent recovery path that does not rely on public IP reachability, ensuring administrative access remains available during upstream filtering or routing incidents.
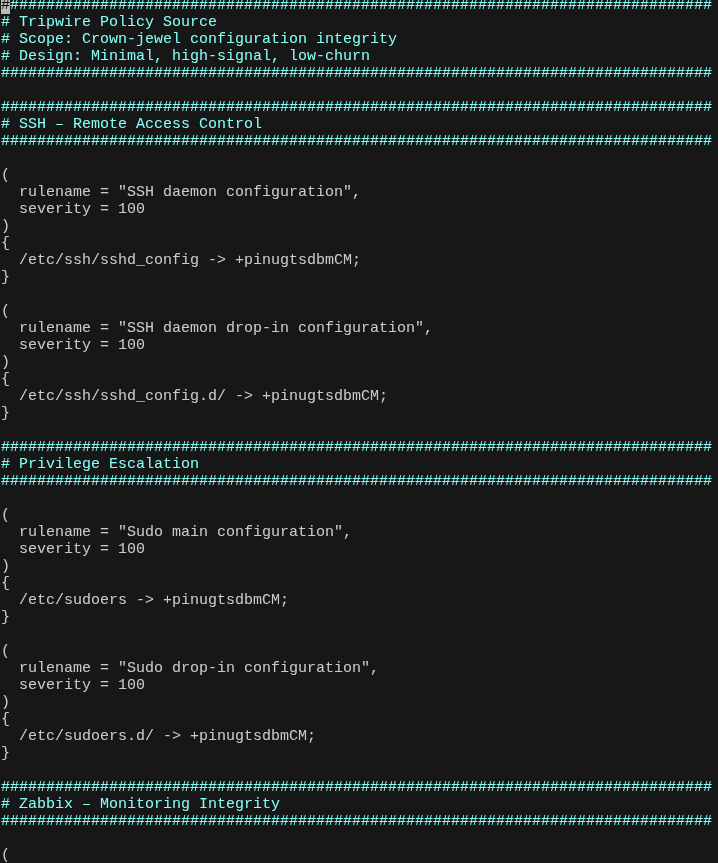
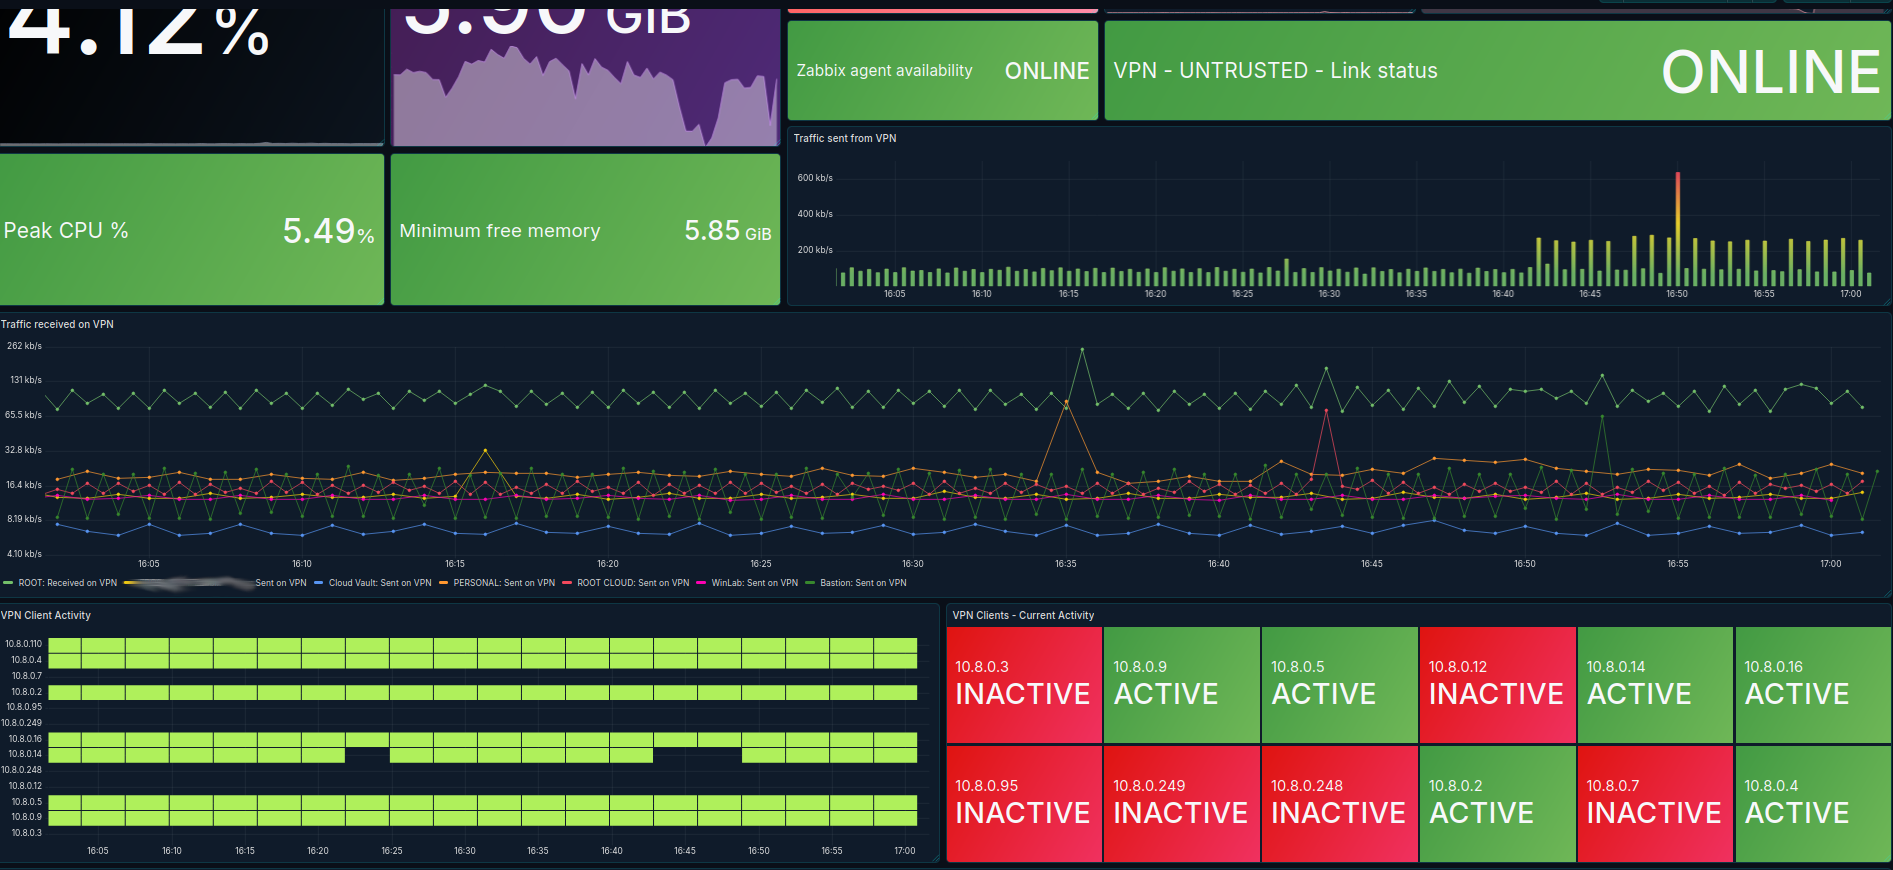
Zabbix operates as the authoritative monitoring and alerting control plane for the environment, consolidating system state, network health, and custom telemetry into a unified observability domain.
- Passive agent model (primary design choice): agents permit inbound connections from the Zabbix server, allowing high-frequency polling of critical metrics. This enables granular monitoring of interface counters, resource usage and other time-sensitive signals in which benefit greatly from higher accuracy.
- High-resolution polling for key metrics: short polling intervals provide near real-time visibility, reducing detection latency for important state transitions. Security metrics benefit greatly from this, especially if you were in a post exploit state.
- Trapper items for event-level accuracy: bespoke scripts emit telemetry directly to Zabbix at execution time, enabling alerting precision beyond fixed polling intervals. This allows detection at the moment of state change rather than at the next scheduled check.
- Active checks retained as fallback: while passive checks are preferred due to full network control of agents, active checks remain enabled to provide resilience if inbound polling is disrupted.
- Secure agent authentication: all agents communicate using pre-shared keys (PSK), ensuring encrypted transport and strong identity verification between host and server.
- Custom telemetry integration: UserParameters and auxiliary bash scripts extend visibility beyond default templates, enabling environment-specific operational checks without fragmenting the monitoring domain.
- Single alerting pipeline: triggers are normalised through Zabbix and escalated via Telegram, ensuring deterministic alert handling and avoiding multiple disconnected notification systems.
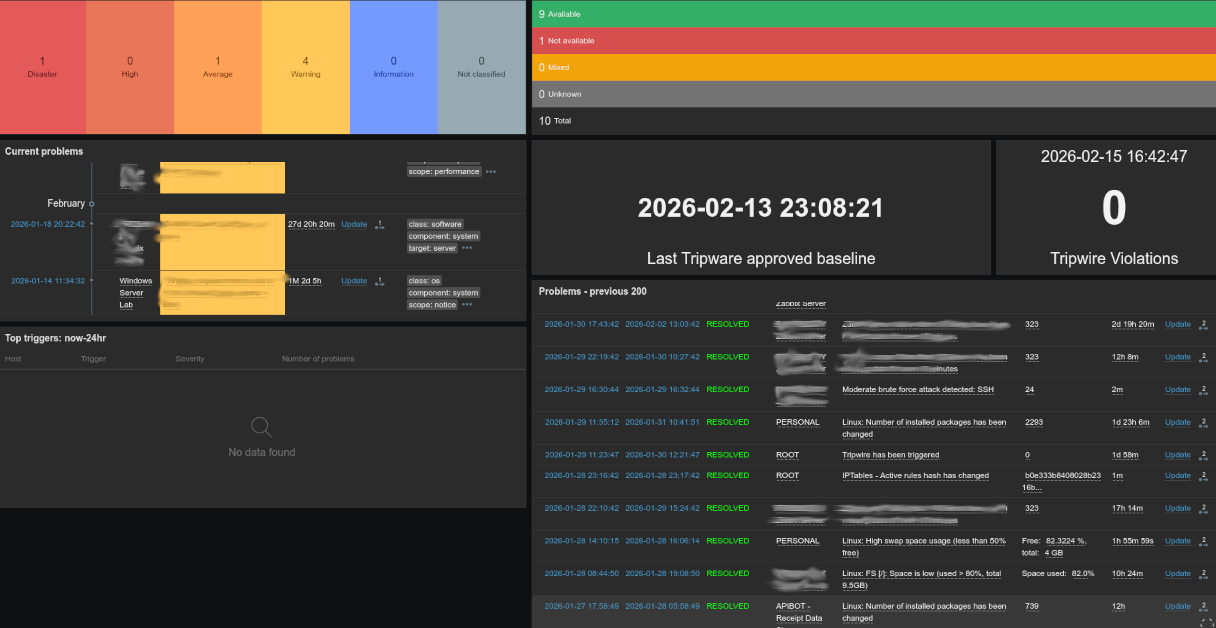

Zabbix is treated as a crown-jewel service within the environment. Compromise or unauthorised exposure would present a high-impact risk across the monitored infrastructure. As such, layered controls are enforced at both the network and application levels.
Access to the web interface requires TLS client-side certificates in addition to standard authentication, ensuring mutual authentication and preventing unauthorised access even if perimeter controls were misconfigured.
In addition, a dedicated Raspberry Pi node continuously verifies that the Zabbix service is not bound to any non-VPN or non-loopback interface, providing an automated safeguard against accidental exposure.
Grafana provides the analytical and visualisation layer for infrastructure telemetry. Zabbix remains the authoritative alerting engine, while Grafana enhances data exploration, correlation, and long-term trend analysis.
- Primary data source: Zabbix database — infrastructure metrics are visualised through Grafana dashboards backed by the Zabbix data source plugin.
- Multi-source capability: Grafana directly queries additional databases where appropriate, enabling correlation of metrics across services without duplicating monitoring logic.
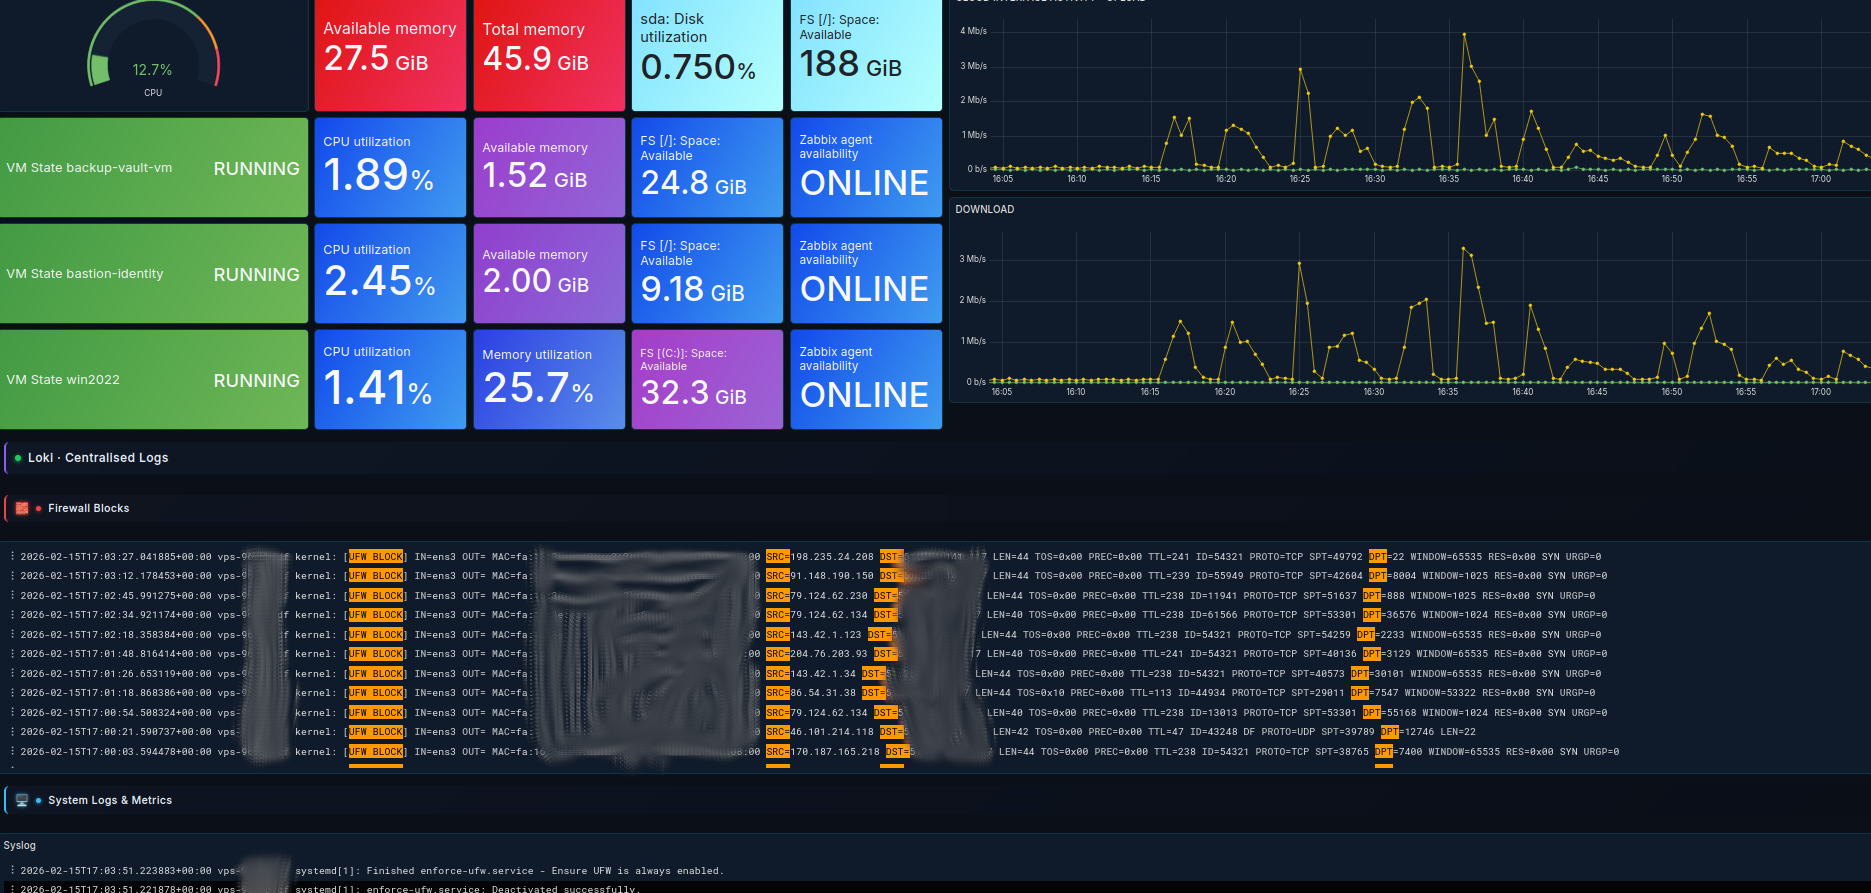
- Loki integration for log aggregation: system and application logs are ingested into Loki and surfaced in Grafana, allowing structured log querying, parsing, and time-aligned correlation with infrastructure metrics.
- Metric-to-log correlation: combining Zabbix-derived metrics with Loki log streams enables faster root cause analysis during incident investigation.
- Operational clarity: dashboards are designed to reduce cognitive load by presenting high-signal metrics and eliminating redundant visual noise.
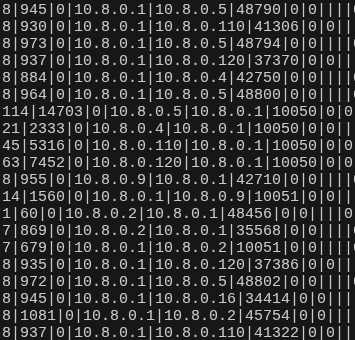
pmacct is deployed on the ROOT node to aggregate network flows from the WG0 interface into a structured SQLite datastore. This provides near real-time visibility into peer behaviour, protocol usage, and routing anomalies beyond what firewall counters alone can reveal.
- Interface-level flow aggregation: flows are captured from the WG0 interface and written to SQLite at short intervals.
- Pre-drop visibility: flows are recorded before firewall rejection to detect attempted misuse.
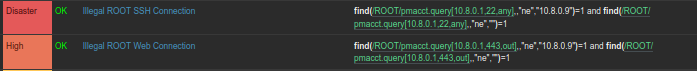
- Illegal IP pairing detection: abnormal source/destination combinations surface segmentation drift.
- New port discovery: previously unseen port usage per WireGuard peer is highlighted.
- Excessive traffic detection: unusual byte or packet volumes are correlated with peer identity.
- Custom query automation: parameterised Bash script accepts host, direction, and port to return IP associations from the last 10 minutes.
- Zabbix integration: UserParameters automate database interrogation for alerting.
- Grafana visualisation: active port usage and peer activity trends are displayed with sub-10-minute granularity.

This page outlines selected core infrastructure services, but is not exhaustive by any means. The subsequent section provides additional context, implementation notes, and supporting evidence relevant to the system’s security architecture and common usage.